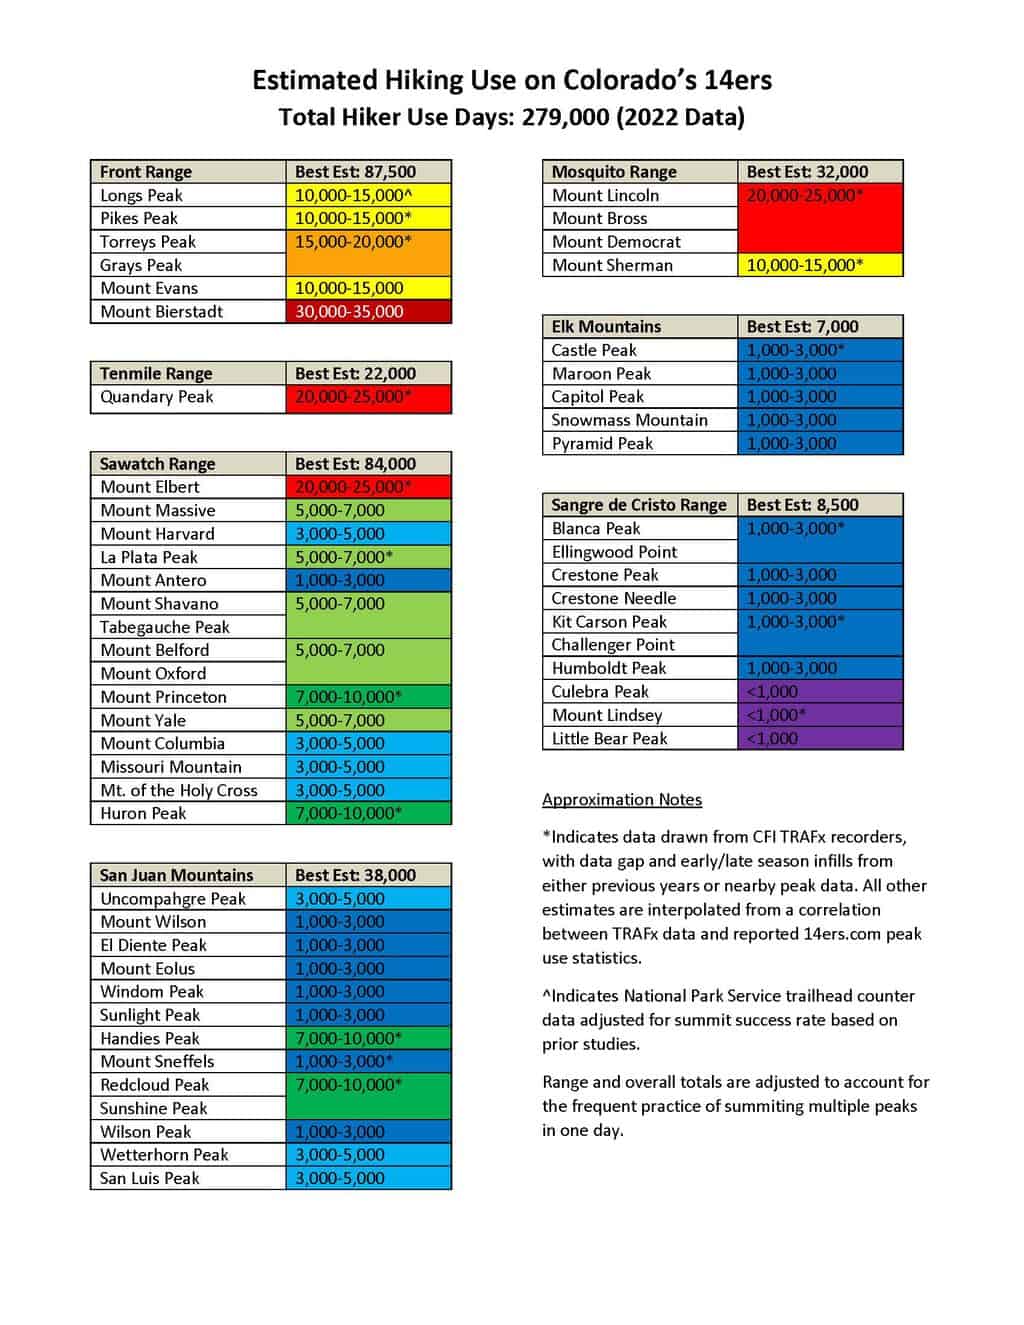
CFI’s estimate of hiking use suggests a statewide economic impact of almost $75.7 million directly attributable to hiking 14ers based on economic expenditure studies performed by Colorado State University economists John Loomis and Catherine Keske. Their 2009 study found that climbers of Quandary Peak near Breckenridge spent an average of $271.17 per day for gasoline, food, lodging, equipment and other retail purchases.[i] This expenditure estimate has not been updated in more than a decade, so it is likely understated.
[i] Loomis, John and Catherine Keske, “Did the Great Recession Reduce Visitor Spending and Willingness to Pay for Nature-Based Recreation? Evidence from 2006 and 2009,” Contemporary Economic Policy, Vol. 30, No. 2, April 2012, pp. 238-246.
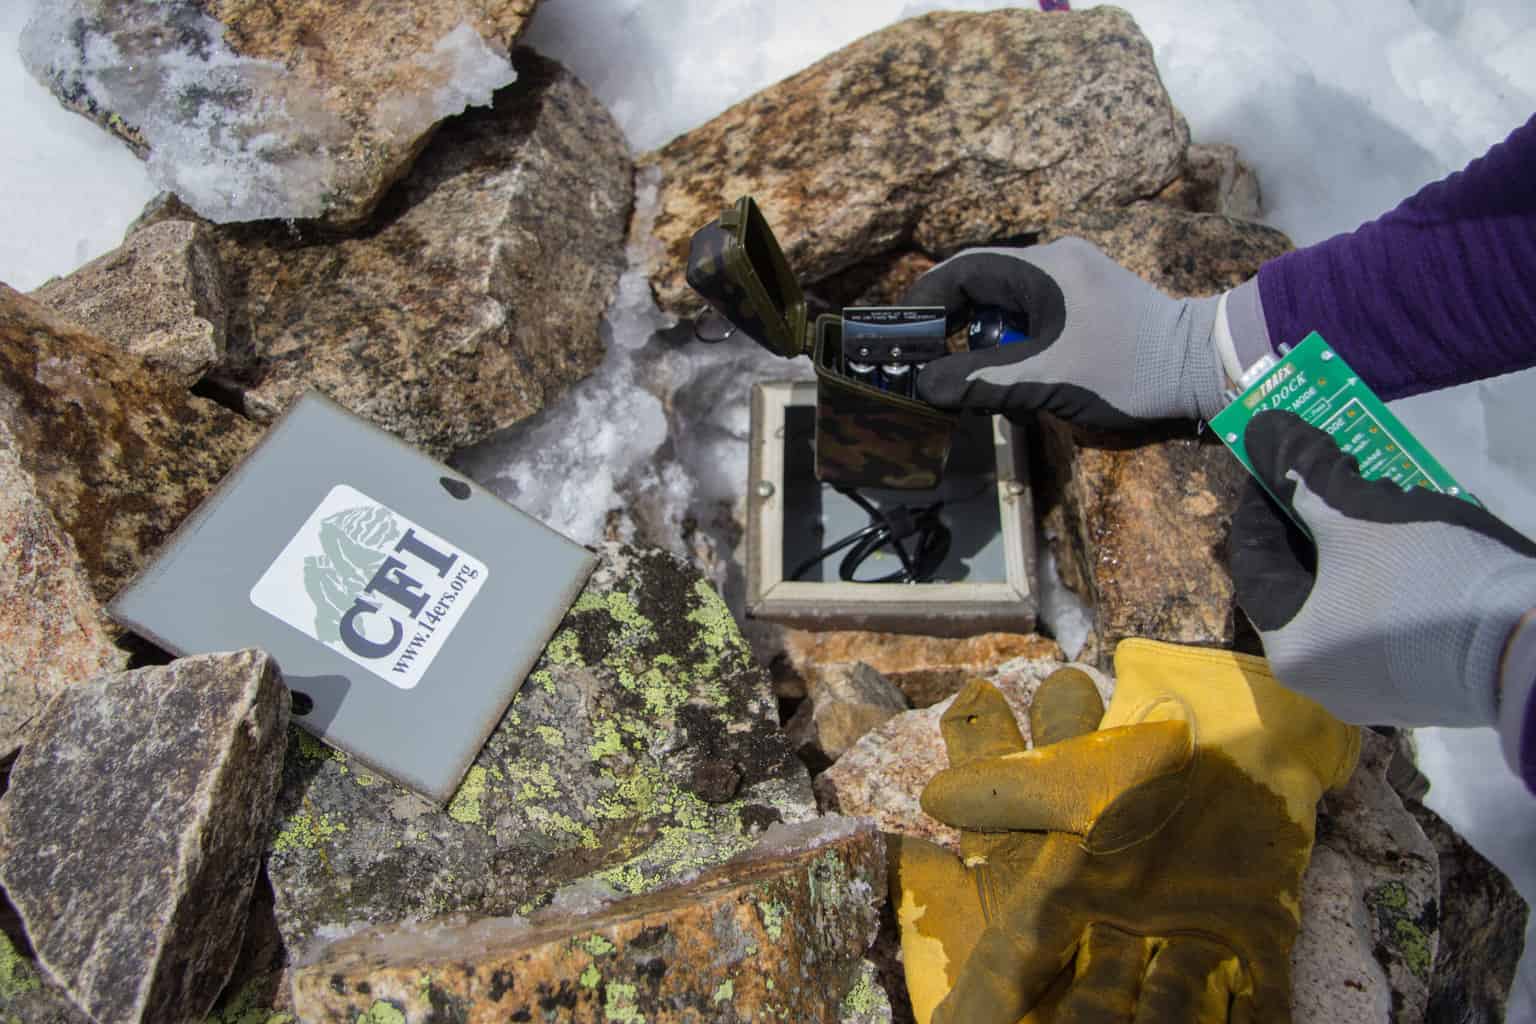
Lloyd Athearn installing an infrared trail counter in early June.
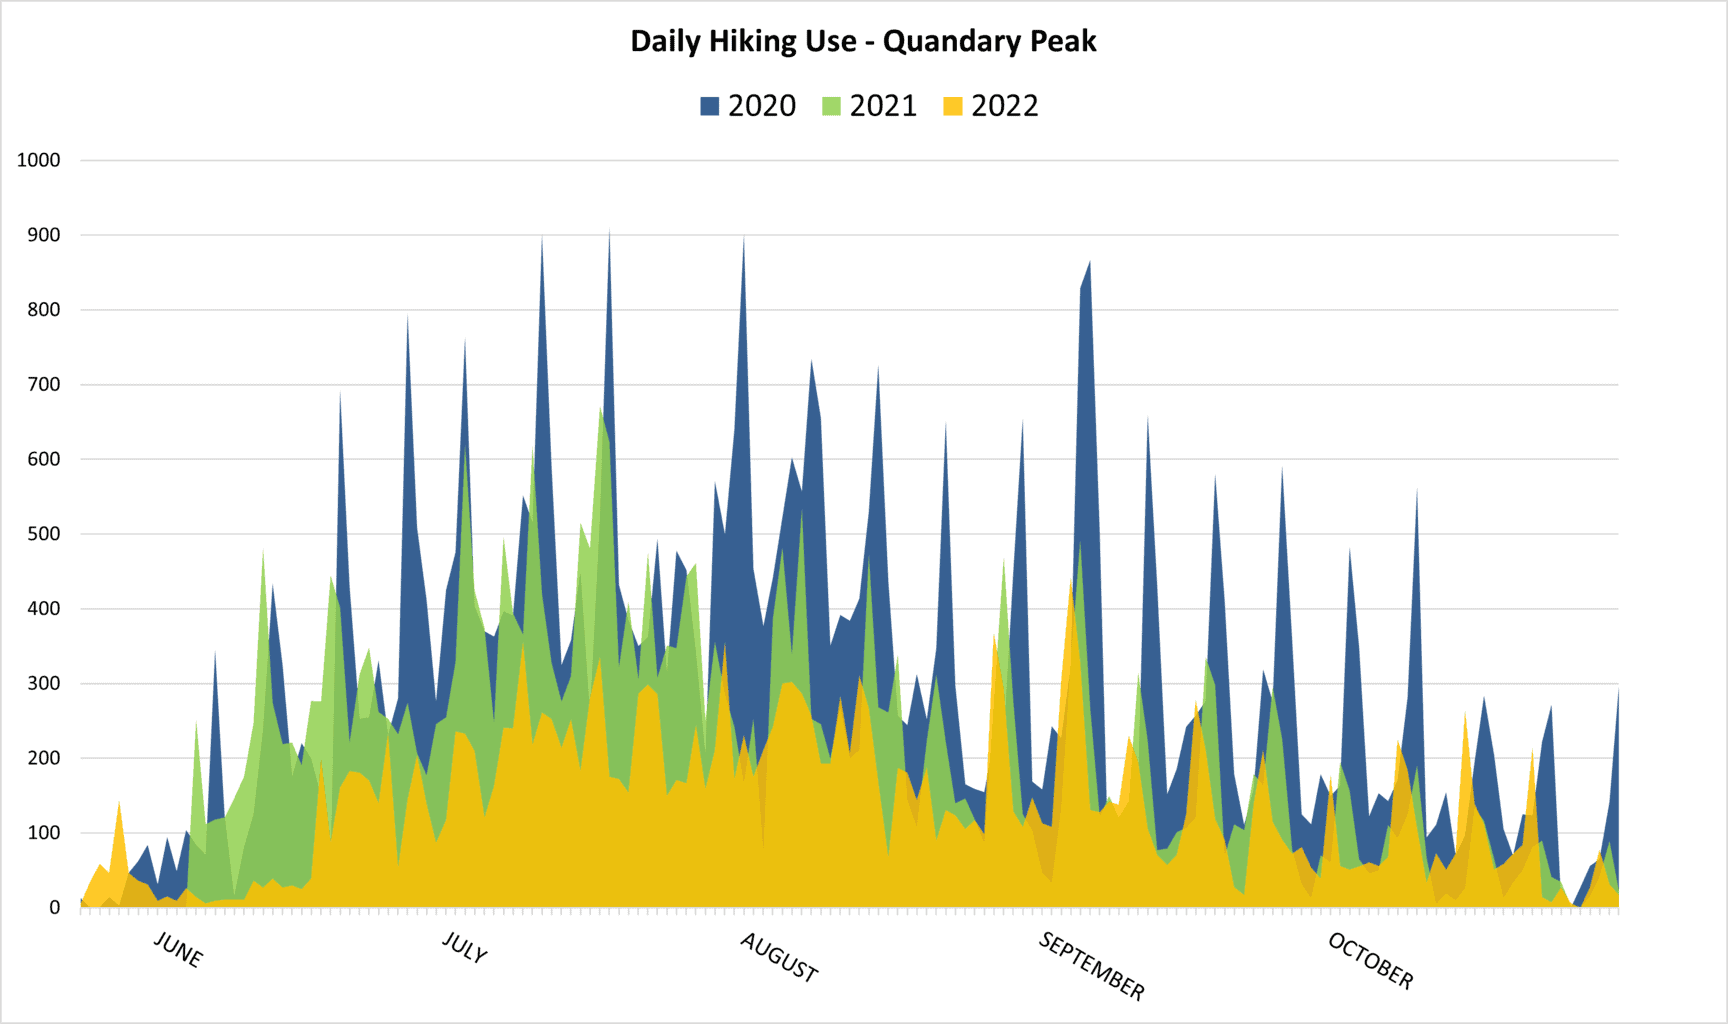
CFI’s most recent hiking use report culminates seven seasons of data collection at up to 23 sites tracking use on up to 21 14er peaks across the state. (There were five counters in 2014, 10 counters in 2015, 20 counters in 2016-2017, 22 counters in 2018-2019, and 23 counters in 2020-2022.) CFI’s hiking use projections are based on the combination of several data sources:
1) CFI collected hour-by-hour data during the 2022 hiking season using compact infrared trail counters that were placed at 23 locations adjacent to summit hiking trails servicing 21 14er peaks. Hiking use is estimated for the period between May 24 and October 10. Missing data were modeled using a linear model incorporating week number, day of the week, holiday and use levels on other similar peaks, which has shown to be statistically accurate.
2) Hiking use projections for all other 14ers were based on crowdsourced “14er checklists” submitted to the 14ers.com website by more than 22,790 individual hikers. Estimates for peaks without trail counters were determined using a trend line calculated by the relative frequency of reported hiking use on all peaks using data points as anchors for peaks that had trail counters in 2022.
In 2020, Matt Albritton, a Yale undergrad studying computer science and engineering, helped further refine CFI’s data modeling program that was originally developed in 2016. Matt cleaned and rewrote the program’s code and created an updated version using Python. The program helps fill in gaps in the data due to obscured counter sensors or periods in the early or late season when the counter is not in place. This model incorporates the week of the season, day of the week, holidays, and similar peaks with data to fill in missing data. See an example below of the predicted vs. measured data.
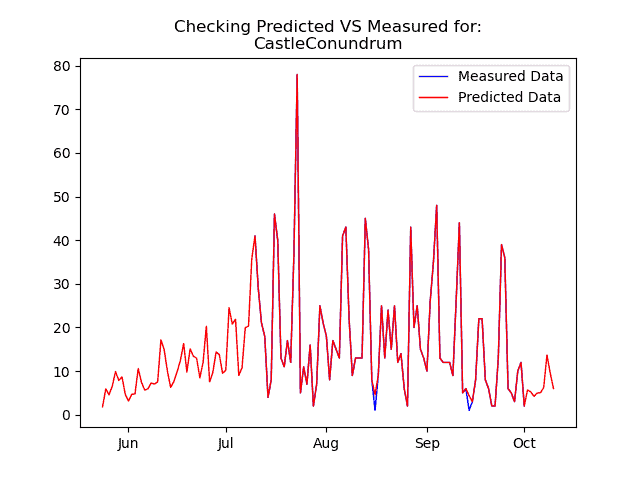
CFI uses a multi-factor modeling program to predict hiking use levels when we do not have a counter on a given peak or when there are data gaps. The program’s modeled data for use levels on Castle Peak (red line) largely mirror what was actually recorded by our counter (blue line). The program’s predictions are helpful to fill in the early season gap when CFI’s trail counter was not yet in the field.
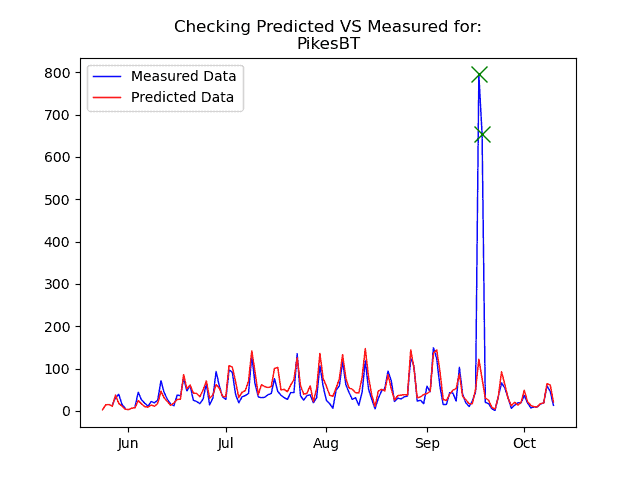
In this chart, we again see that CFI’s program has accurately predicted hiking use on Pikes Peak’s Barr Trail (red line). However, the program did not anticipate the increased hiking use which occurred in September during the Pikes Peak Ascent and Marathon. CFI flags these outliers (green X) in our modeling program to ensure that estimates for other peaks do not include these spikes in use.
Special thanks goes out to CFI’s summer CLIMB interns Emily Barnes (2016), Claire Gomba (2017), Nick Dahl (2018), Jackson Burton (2019), Matt Albritton (2020), and Farah Stack (2021) who helped place trail counters, analyze data, and refine CFI’s estimates.
Additional Links:
2021 14er Hiking Use Estimates
2020 14er Hiking Use Estimates
2019 14er Hiking Use Estimates

